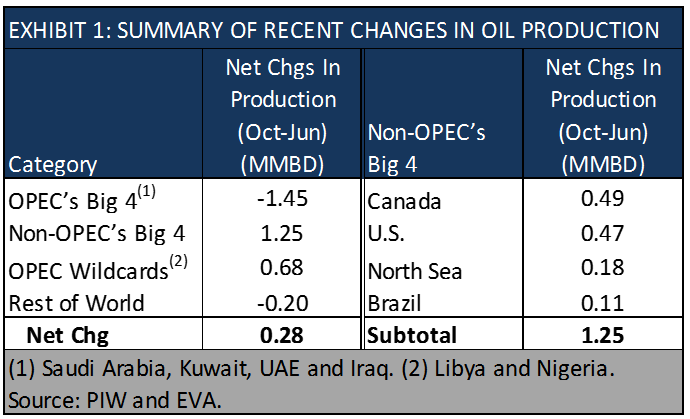
While global oil production data for June is still preliminary, it indicates that global oil production is now above Oct. 2016 levels, despite OPEC’s plan to reduce supply. As illustrated in Exhibit 1, despite OPEC’s Big 4 reducing production levels 1.45 MBD, production increases for OPEC’s two wild cards and Non-OPEC’s Big 4, which is led by Canada, have more than offset their reductions. In addition, recent production increases by Angola, Iran, China and Kazakhstan have arrested the natural decline for the rest of the world.

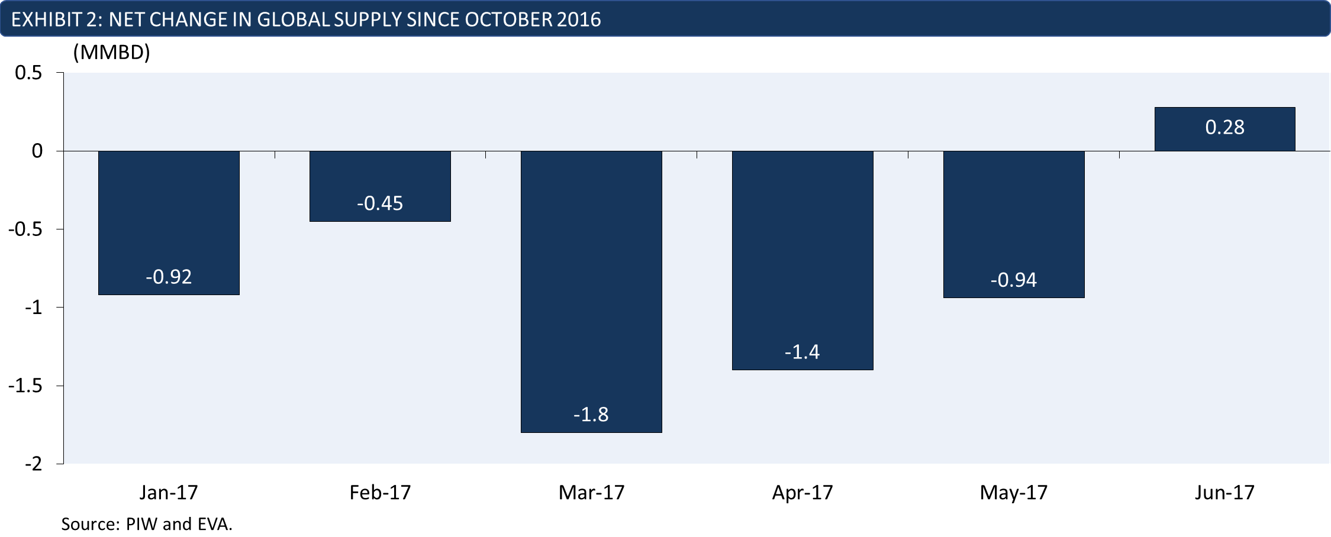
The production results for Jun. represent just one step in the steady erosion of OPEC’s efforts to reduce global oil production that has materialized over the last several months, which is illustrated in Exhibit 2.

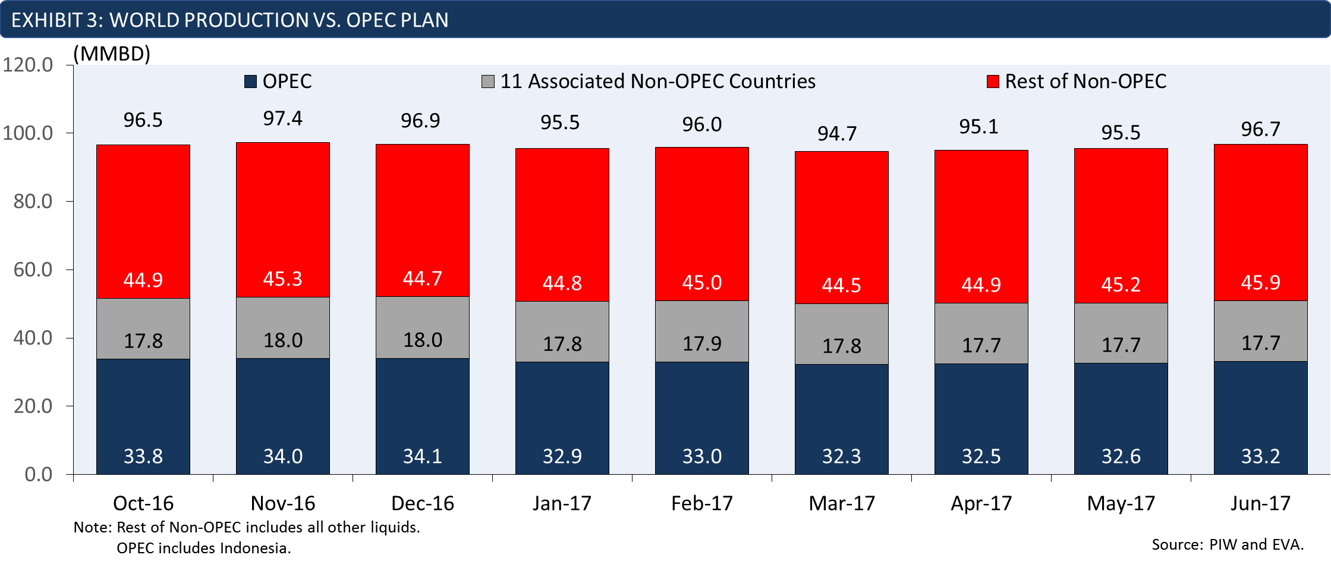
Lastly, Exhibit 3 provides a composite summary of global production since Oct. 2016, which is the reference point for OPEC’s plan. This summary is divided into three categories, namely (1) total OPEC production, (2) production for the 11 Non-OPEC countries participating in the OPEC plan, and (3) the reset of Non-OPEC. As illustrated, Jun. 2017 production is above – not below – Oct. 2016 production levels.

Once the market incorporates into its overall assessment that global production levels have increased, rather than declined, expect downward pressure on oil prices, as the market bulls transition out of their long positions and the market bears increase their short positions.
EVA produces a series of crude oil and petroleum product publications that cover the global oil industry.
- Long-Term Outlook FUELCAST Report (20-yr outlook)
- Monthly/Quarterly Report (3-yr outlook)
- Monthly Newsletter
For more information on North American crude oil markets, please contact us at [email protected].


